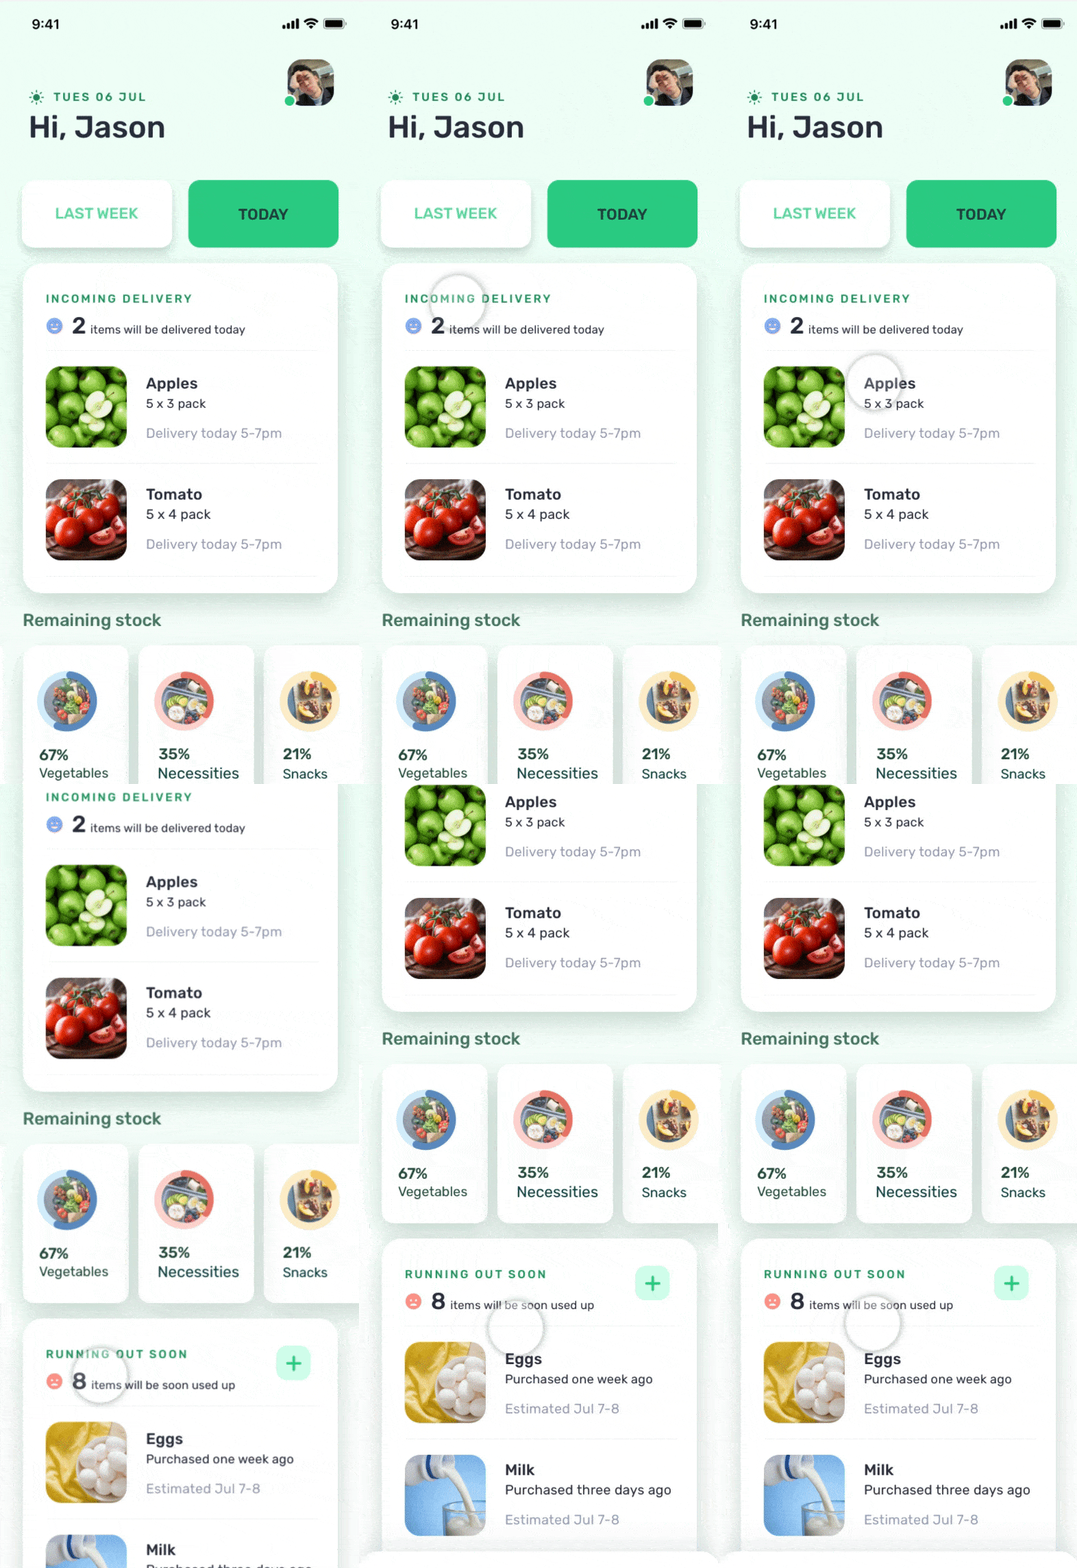
关于 Waymo essential+

Google master challenge 是一个针对人机交互专业研究生的设计比赛。该比赛的主题是基于 Google的《 AI Guide Book》中的方法论来为 Waymo 设计新的以移动性为中心的AI 系统。该比赛需要在三个月内设计出一套包含用户调研,machine learning 数据库和可交互原型的完整概念展示方案,最终参与 Waymo 用户体验团队的评审。最终我和我的设计团队拿到了最佳用户体验奖,十分感谢 Waymo 的 UX leader Ryan,他在担任项目的导师期间给了我非常多的帮助。
项目背景:
Google的People + AI Research(PAIR)是一个跨学科的团队,通过进行基础研究,构建工具,创建设计框架以及与各种社区合作,探索AI的广泛应用。
Challenge & Outcome:
该项目的研究课题聚焦在如何使用 machine learning 来解决广泛的社会问题。在 COVID-19 的影响下,出门购买必需品的安全性成为了世界人民的一个负担。我的设计团队选择了这一话题进行设计,并对该话题进行了深入的调研。
My role:
我负责该项目的用户研究和界面与交互设计,设计团队中除了两名交互设计师外还有一位在丰田市场部门工作超过十年的行业专家。该项目的导师来自 Waymo 的交互设计团队。
以人工智能的力量驱动新的购物体验


WHEN WE TALK ABOUT GROCERY STORE SHOPPING...
Keeping essentials stocked at home accounts for most time spent grocery shopping.
But it’s the least enjoyable part of the shopping experience.

MOST of the time is tedious and boring to grab necessities as usual
“It's boring to spend most of your time in the grocery store picking up the same things from the same shelves every time.” --- Jesse
FEW of the time is delightful to explore new foods at the grocery store
“Exploring new items in the grocery store with your family is a ritual that makes life more interesting.” ---- Hugo

COVID-19 PANDEMIC
72% of people are still hitting the grocery store;
83% of people have had issues with grocery delivery.
People need to minimize the time in stores and improve efficiency.
--- Bankrate.com & YouGov
USER NEEDS
Based on our research, we think it comes down to these 4 key needs, prediction, delivery, eating healthier, and controlling spending.

PAINPOINTS
Despite the best efforts of stores and retailers, it's still a pain to keep your kitchen stocked with the essentials.

AT HOME, it’s hard to…
-
Control different consumption rate of essentials
-
Remember what items are already used up
-
Plan when and how much to stock

ONLINE, it’s hard to…
-
Compare attributes (i.e.nutrition, price) of different items
-
Know accurate delivery times to avoid parcels being stolen
-
Always get the right item and brand

IN STORE, it’s hard to…
-
Go to same aisles to get same things as always
-
Track how much has been added
-
Stand in line
-
Balance overall nutrition
Now you have Essential, your AI-powered grocery delivery service that keeps your kitchen stocked with just enough essentials.
What do we mean by “just enough”? Perfect quantity, accurate delivery time, healthier contents, and prudent budget management. Every service that we provide will be just what you want, no data mining, no over selling.
BEFORE
Before Essential, grocery shopping, as demonstrated from user pain point, it was an exercise in boredom at best and frustration at worst.
NOW
Now you no longer need to experience that tedium. Instead, you can get exactly all the essentials you need every week at home, and then have an efficient and delightful time to explore new stuff in the grocery store.
How does Essential get us there?
First, there are two crucial pieces of information we need in order to set-up our model and better serve you--- your food consumption rate and available time schedule.

ONBOARDING-QUICKLY
-
Household structure
-
Eating habits
-
Purchase history
-
Smart home devices
-
Food consumption rate
-
Available time schedule
Welcome to the primary features of Essential:
Perfect quantity prediction and just-in-time delivery.
CORE USER SCENARIOS


PERFECT-QUANTITY
-
Perfect quantity
-
Perfect delivery frequency
CORE USER SCENARIOS


JUST IN TIME-DELIVERY
-
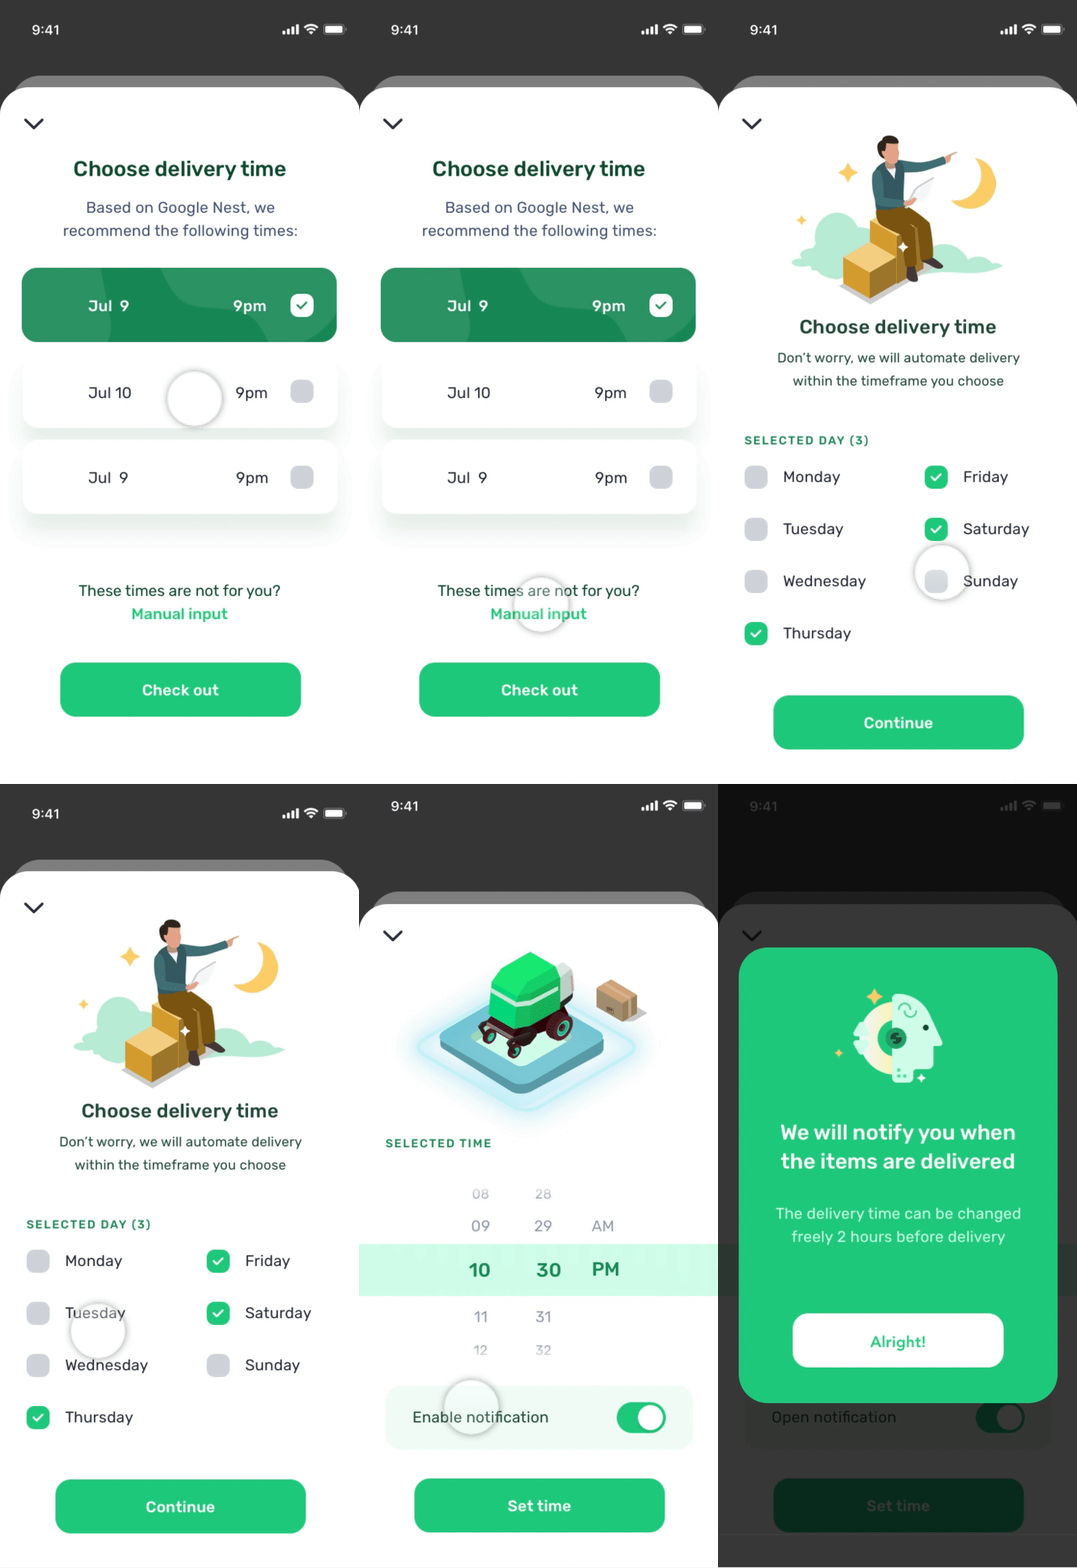
Available time periods
-
Easy time scheduling
-
Deliver whenever it is convenient for you
CORE USER SCENARIOS


HEALTHIER
SUBSTITUTION
-
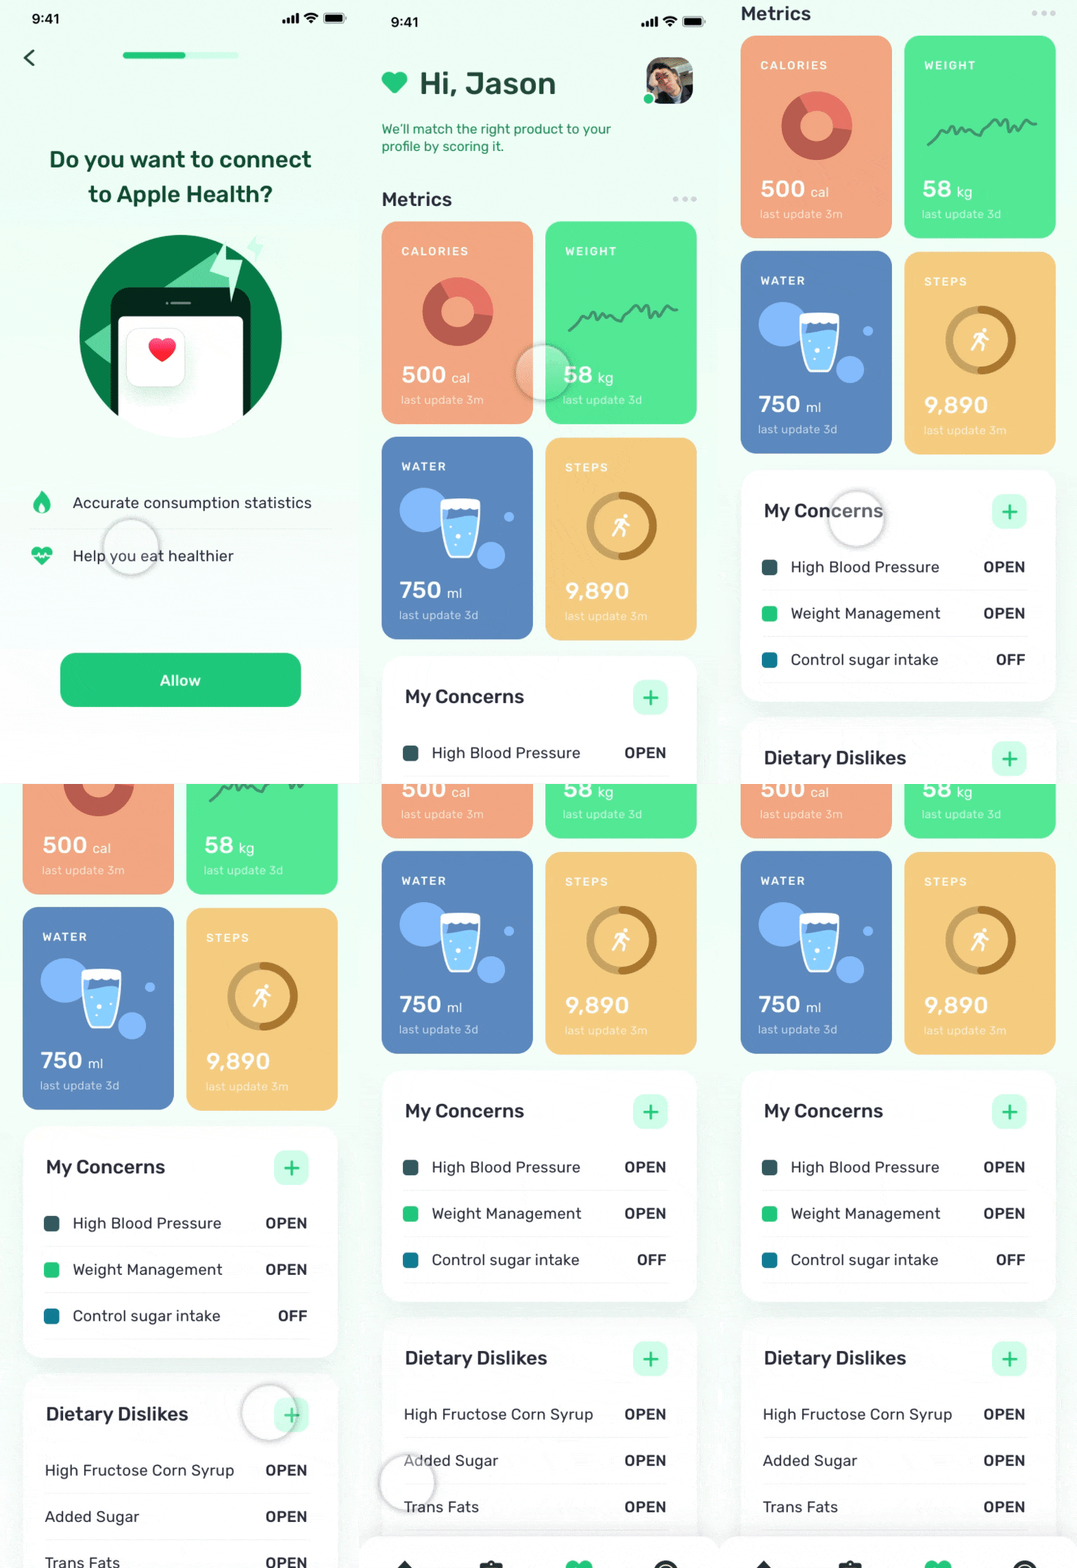
Health condition
-
Food preference
-
Goal (optional)
-
Biometrics & Diet profile
-
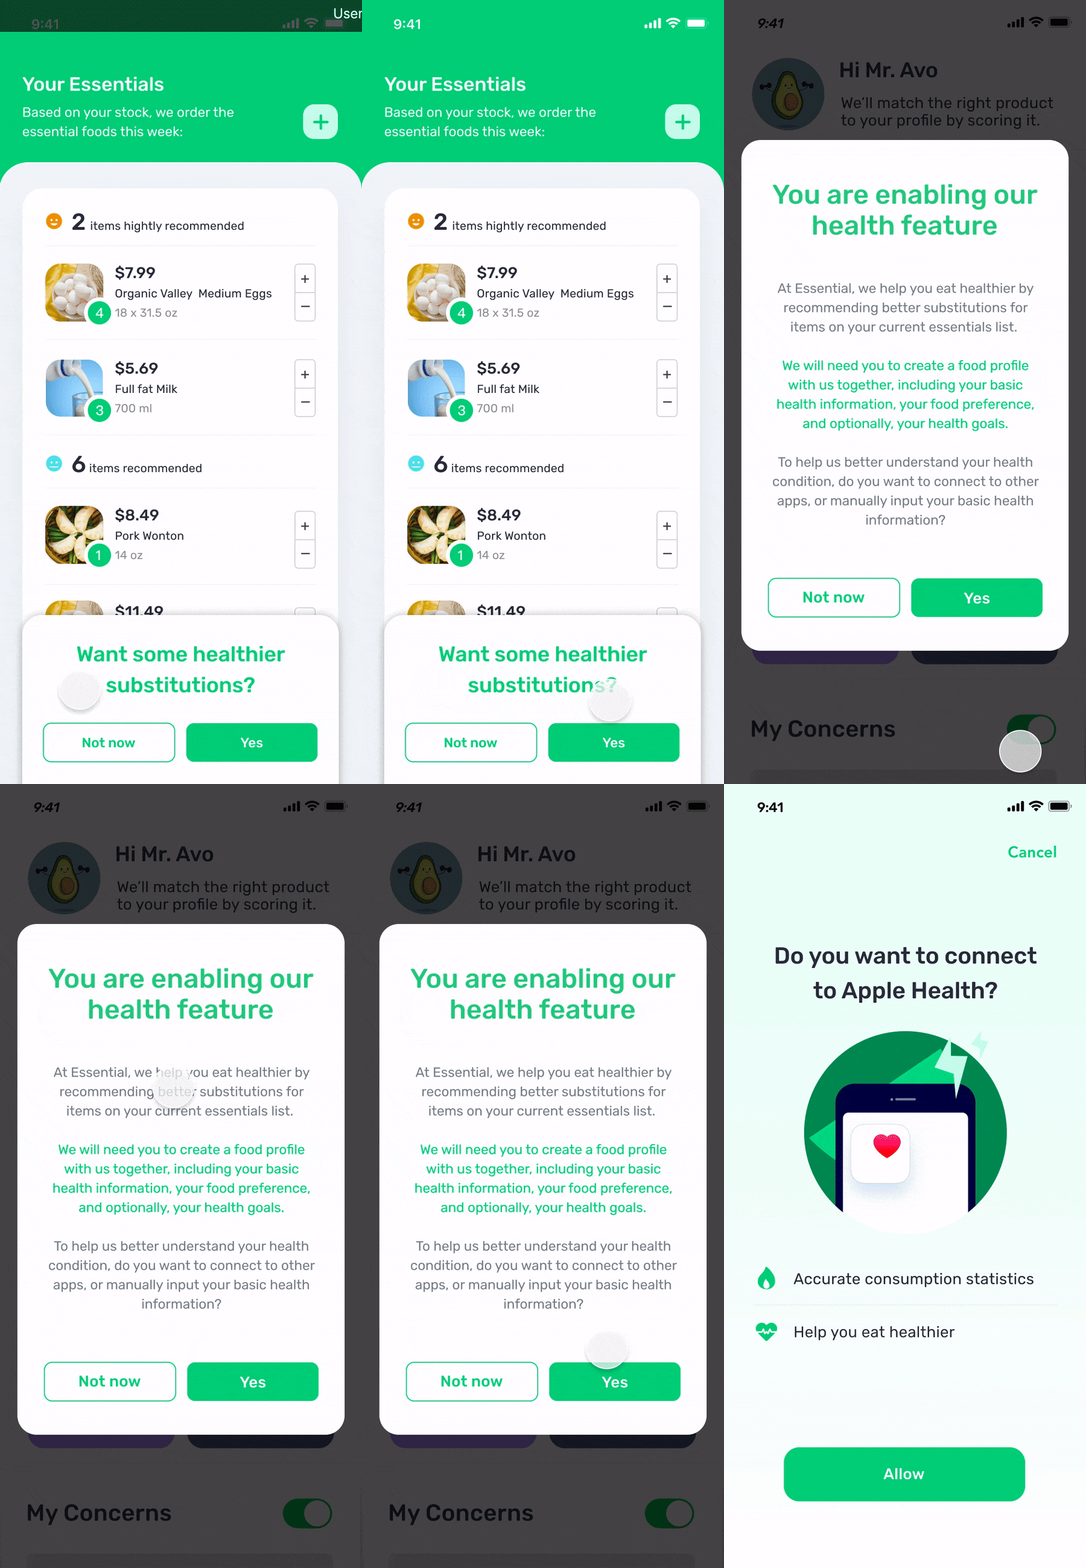
Healthier substitution
recommendations
CORE USER SCENARIOS


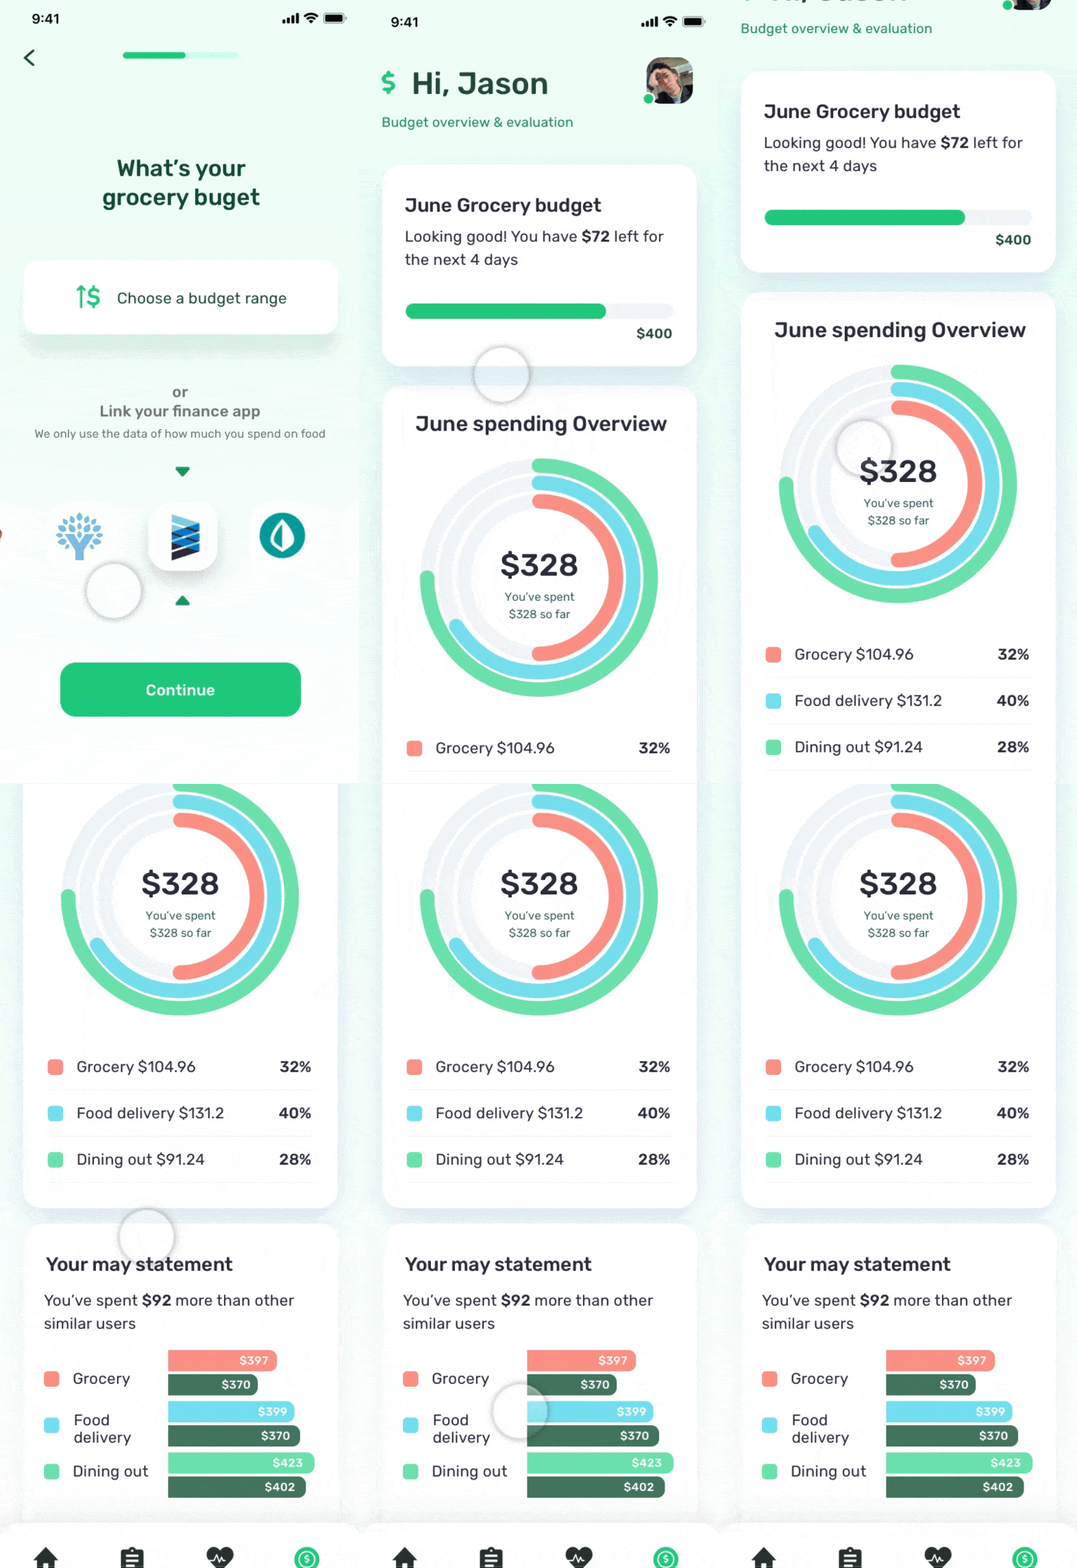

PRUDENT BUDGET
MANAGEMENT
-
Budget range
-
Food expenditure
-
Budget reference and evaluation
PRUDENT BUDGET MANAGEMENT
Budget overview & evaluation
By referencing your budget information and our overall dataset, we can provide an average reference in terms of similar household structures’ food expenditure every month.
You can have a general idea of how you spend money on essentials without any pressure.
I think you wonder why we choose AI to provide these features. We think to provide better quality of service, we have to deal with varieties of food consumption your availability and health conditions.
AI is the best tool because it is good at recognizes and categorizes food consumption and storage by user group, personalizing foods recommendations and predicting when you should refill the stock.
HOW AI HELP US ACHIEVE CORE SCENARIOS?

ROADMAP
Toward a delightful grocery shopping journey, as phase 1 , we will help you get essentials more efficiently online. As mentioned in phase 3 and 4, in the future, we plan to improve in-store shopping experience with AR and offer more fun virtual shopping with VR. Let’s go back to ESSENTIALS and let me explain the system and data side.
.png)
POSSIBLE RATERS

-
Understand how to estimate food consumption rate
-
Possess a background in nutrition-related disciplines.
Nutritionist, Dietitian, Food Technologist, etc
HOW WE LEVERAGE AI
This is the overview, how we’ve leveraged AI including raters and dataset, starting from “4 user needs” from the left side and shows data collection, labeling, processing and feedback.

User Healthiness

Datasource
-
Exercise/lifestyle IoT/App
(Apple Health, Peloton, Shopwell, etc) -
USDA Datasets
(Food nutrition facts, Dietary guideline)
We also create a food healthiness dataset to recommend appropriate healthier substitutions for each of you.
Based on the nutrition data, the raters label the food health level and particular concerns of each food for certain types of people. Why do we label both of them? Because even though a food, for example milk, has health level A, it is not healthy for people who have lactose intolerance.
Food Healthiness

According to the dataset, the raters should be specialists of foods and nutritions such as nutritionists, dietitians and food technologists.

POSSIBLE RATERS
-
Understand how to estimate food consumption rate
-
Be familiar with North American foods and how they are stored
American homemaker, Chef, Tidying expert, etc
HEALTHINESS DATASET
We plan to use two datasets. First one is user healthiness for the purpose of personalizing our service in line with the your health. Even though there is lots of medical data, we decide to collect age, BMI, blood pressure and calorie consumption because they are minimum but many enough for the rater to assess the health level.
Food storage and consumption

-
User input
-
Partnering with Samsung to detect when items in the refrigerator have been depleted
-
Weight data from the refrigerator or food containers to see how fast foods are eaten
In addition, to grasp the food consumption and storage, we also plan to utilize images in a fridge that come from smart fridges or pictures that our user takes, because image recognition is one of what AI is good at.
Food storage and consumption

However, here is a problem. Situations in the fridge are very different in each household. As you can see in the 2 images on the slide, some people prefer to preserve foods in a container while others do not, like me. So,who can help?
The raters can help. They teach which foods are stored and how enough they are, considering your household structures.
FOOD QUANTITY DATASET
We would like to deep down into the details of the dataset and raters of food quantity and healthier foods.
First, these tables are 2 of 3 datasets of food quantity prediction. We need these dataset to calculate food consumption rate and predict quantity of next purchase. About purchase history on the top, we get when, how many and how much you buy each food. We assume that labeling is not necessary, because the machine learning model can mathematically predict when the foods would be depleted.
For example, for user A, the model can predict he buys one pack of eggs every 7days on average, based on the purchase history from Amazon.
Purchase history

Datasource
-
Purchase history from Amazon
-
Quantitative survey of 10,000 households across the U.S.
-
Qualitative research -observing different types of families
So far we have collected sufficient data to run our model, then how can we know if the machine made the right decision for each single user? And how to keep engaging users to input feedback so the future service can be improved. Here comes to the last part of the whole process---Getting feedback.
At Essential, we have two main principles to gather informative data from users.
First, we introduce the features within the relevant context. Second, we collect the feedback in a simple and engaged way.

FEEDBACK
-
Introduce features at the right moment
-
Collect user feedback in easy and gamified ways


